
File:2011 Pacific typhoon season summary.png

Size of this preview: 800 × 600 pixels. Other resolutions: 320 × 240 pixels | 640 × 480 pixels | 1,024 × 768 pixels | 1,280 × 960 pixels | 2,560 × 1,920 pixels | 4,000 × 3,000 pixels.
Original file (4,000 × 3,000 pixels, file size: 7.61 MB, MIME type: image/png)
| This is a file from the Wikimedia Commons. Information from its description page there is shown below. Commons is a freely licensed media file repository. You can help. |
| Description |
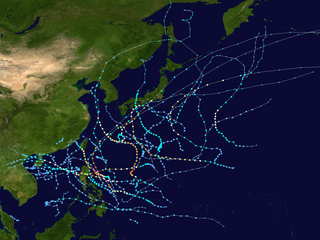
English: This map shows the tracks of all tropical cyclones in the 2011 Pacific typhoon season. The points show the location of each storm at 6-hour intervals. The colour represents the storm's maximum sustained wind speeds as classified in the Saffir-Simpson Hurricane Scale (see below), and the shape of the data points represent the type of the storm.
Tropical depression (≤38 mph, ≤62 km/h)
Tropical storm (39–73 mph, 63–118 km/h)
Category 1 (74–95 mph, 119–153 km/h)
Category 2 (96–110 mph, 154–177 km/h)
Category 3 (111–129 mph, 178–208 km/h)
Category 4 (130–156 mph, 209–251 km/h)
Category 5 (≥157 mph, ≥252 km/h)
Unknown
Storm type |
| Source | Created using Wikipedia:WikiProject Tropical cyclones/Tracks. The background image is from NASA [1]. The tracking data is from the Joint Typhoon Warning Center's best track database |
| Author | Keith Edkins |
| This work has been released into the public domain by its author, Keith Edkins. This applies worldwide. In some countries this may not be legally possible; if so: Keith Edkins grants anyone the right to use this work for any purpose, without any conditions, unless such conditions are required by law. |
File history
Click on a date/time to view the file as it appeared at that time.
| Date/Time | Thumbnail | Dimensions | User | Comment | |
|---|---|---|---|---|---|
| current | 23:58, 23 May 2020 | | 4,000 × 3,000 (7.61 MB) | Supportstorm | JTWC/JMA data |
| 08:10, 20 May 2020 |  | 4,000 × 3,355 (10.01 MB) | Modokai | Reverted to version as of 04:30, 1 March 2017 (UTC) | |
| 18:38, 27 August 2018 |  | 4,000 × 3,000 (9.92 MB) | David Petrovsky | Added the dimensions | |
| 04:30, 1 March 2017 |  | 4,000 × 3,355 (10.01 MB) | Supportstorm | Updated | |
| 09:32, 19 September 2015 |  | 3,000 × 2,183 (5.06 MB) | Typhoon2013 | rv back sorry because how about the other JMA TDs? | |
| 19:48, 19 November 2014 |  | 3,000 × 2,494 (5.91 MB) | Supportstorm | --dots 0.2 | |
| 19:58, 22 August 2013 |  | 3,000 × 2,183 (5.06 MB) | Supportstorm | Best track updates | |
| 17:07, 3 January 2012 |  | 3,000 × 1,995 (4.38 MB) | Keith Edkins | Updated with Washi and some depressions | |
| 18:00, 10 November 2011 |  | 3,000 × 1,965 (4.25 MB) | Keith Edkins | Updated with 24W | |
| 11:35, 15 October 2011 |  | 3,000 × 1,965 (4.24 MB) | Keith Edkins | Updated with Banyan |
File usage
The following page uses this file:
Global file usage
The following other wikis use this file:
- Usage on de.wikipedia.org
- Usage on en.wikipedia.org
- Tropical Storm Meari (2011)
- 2011 Pacific typhoon season
- Template:2011 Pacific typhoon season buttons
- Typhoon Ma-on (2011)
- Tropical Storm Nock-ten
- Typhoon Muifa (2011)
- Typhoon Nanmadol (2011)
- Tropical Storm Talas (2011)
- Typhoon Roke (2011)
- Tropical Storm Aere (2011)
- Typhoon Nesat (2011)
- Typhoon Nalgae (2011)
- Tropical Storm Washi
- Timeline of the 2011 Pacific typhoon season
- User:Tfmbty/2011 Pacific typhoon season
- Typhoon Songda (2011)
- Tropical Storm Sarika (2011)
- Usage on fr.wikipedia.org
- Usage on ja.wikipedia.org
- Usage on ja.wikinews.org
- Usage on ko.wikipedia.org
- Usage on nl.wikipedia.org
- Usage on pt.wikipedia.org
- Usage on th.wikipedia.org
- Usage on tl.wikipedia.org
- Usage on vi.wikipedia.org
- Usage on www.wikidata.org
- Usage on zh-yue.wikipedia.org
- Usage on zh.wikipedia.org
View more global usage of this file.