
Table (information)


A table of information is a set of facts arranged in rows and columns.[1] It is a way of displaying information. It requires a medium, such as writing or print on paper, or a computer monitor. It is both a mode of visual communication and also a way to set out data.
A table consists of an orderly arrangement of rows and columns. The columns and rows usually have names or labels. Tables may include notes, headers, footers or other features. Like other graphic forms such as diagrams and illustrations, tables are often used together with prose. In books and articles, tables are often given numbers and captions.
Tables were the first way to print social and scientific data, before any other kind of graphics like graphs and charts. All the information about a modern society was recorded and published first as tables. Marriage certificates were written tables. Census results were recorded as tables, and later analysed in printed tables.[2] All weather observations were published as printed numerical tables. Many kinds of reports to Parliament contained tables of data. Many of these methods were invented in Britain, because the government collected statistics about the population, and then published the results.[3]
The use of tables is widespread in all types of communication, research and data analysis. Tables appear in print media, handwritten notes, computer software, architectural ornamentation, traffic signs and many other places. The details vary according to circumstances. Tables are extremely flexible, and can easily be constructed on computer and in print.[4][5][6][7]
Tables are not always easy to understand, and there is a whole industry which takes table information and turns it into other forms, such as graphs and charts, for the benefit of the reader.[8][9][10]
Related pages[change | change source]
References[change | change source]
- ↑ Concise Oxford Dictionary
- ↑ The taking of censuses is ancient (St. Luke, chapter 2), but the publication of statistical analysis in tables is modern.
- ↑ Nissel M. 1987. People count: a history of the General Register Office. HMSO, London.
- ↑ Fink, Arlene (2005). How to conduct surveys. Thousand Oaks: Sage Publications. ISBN 141291423X.
- ↑ McNabb, David (2002). Research methods in public administration and nonprofit management. Armonk: M.E. Sharpe. ISBN 0765609576.
- ↑ Morgan, George (2004). SPSS for introductory statistics. Hillsdale: Lawrence Erlbaum. ISBN 0805847898.
- ↑ Zielinski, Krzysztof (2006). Software engineering: evolution and emerging technologies. Amsterdam: IOS Press. ISBN 1586035592.
- ↑ Schmid, Calvin F. & Stanton E. 1979. Handbook of graphic presentation. Wiley. N.Y.
- ↑ Schmid, Calvin E. 1983. Statistical graphics: design principles and practice. Wiley N.Y.
- ↑ Holmes N. 1984. Designer's guide to creating charts & diagrams. Watson-Guptill N.Y.
-
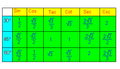 Table of trigonometry relationships
 -
 A table displayed as a sign
 -
 How Saturn's rings appear to us over the 29 years it takes Saturn to orbit the sun
 -
 Printed logarithm tables


