From Simple English Wikipedia, the free encyclopedia
Alabama's 7th congressional district Alabama's 7th congressional district - since January 3, 2013.
Representative Area 8,780 sq mi (22,700 km2 ) Distribution 72.16% urban[1] 27.84% rural Population (2019) 670,015[2] Median household $38,023[3] Ethnicity Occupation Cook PVI D+20[4]
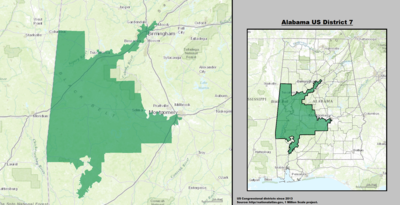
Alabama's 7th congressional district is a United States congressional district in the state of Alabama that elects a representative to the United States House of Representatives . The district includes the counties of Choctaw , Dallas , Greene , Hale , Lowndes , Marengo , Pickens , Perry , Sumter and Wilcox . Parts of Clarke , Jefferson , Montgomery and Tuscaloosa counties are in the district. The district also has parts of the cities of Birmingham , Montgomery and Tuscaloosa /Northport city areas.
The 7th congressional district is the only congressional district in Alabama to be represented by a Democrat . The representative is Terri Sewell . The district was created in 1843 and has only been represented by a Republican for 6 years. When the districts were being drawn again in 2010 the Republicans in Alabama drew the district to have many of the Democratic Party counties in Alabama so there would only be one Democratic congressional district in Alabama. This is called gerrymandering .[5]
Alabama's 7th congressional district election, 2002
Party
Candidate
Votes
%
Democratic Artur Davis
153,735
92.30%
Libertarian
Lauren Orth McCay
12,100
7.31%
Write-in
Write-ins
474
0.29%
Majority
141,635
84.9%
Total votes
166,309
100.00%
Democratic hold
Alabama's 7th congressional district election, 2004
Party
Candidate
Votes
%
Democratic Artur Davis (Incumbent)
183,408
75%
Republican
Steve Cameron
61,019
25%
Write-in
Write-ins
211
0.09%
Majority
122,389
50%
Total votes
244,638
100%
Democratic hold
Alabama's 7th congressional district election, 2006
Party
Candidate
Votes
%
Democratic Artur Davis (Incumbent)
133,870
99%
Write-in
Write-ins
1,297
1%
Majority
132,573
98%
Total votes
135,167
100%
Democratic hold
Alabama's 7th congressional district election, 2008
Party
Candidate
Votes
%
Democratic Artur Davis (Incumbent)
228,518
99%
Write-in
Write-ins
3,183
1%
Majority
225,335
98%
Total votes
231,701
100%
Democratic hold
Alabama's 7th congressional district election, 2010
Party
Candidate
Votes
%
Democratic Terri Sewell
136,223
72%
Republican
Don Chamberlain
51,882
28%
Majority
84,341
44%
Total votes
188,105
100%
Democratic hold
Alabama's 7th congressional district election, 2012
Party
Candidate
Votes
%
Democratic Terri Sewell (Incumbent)
232,520
76%
Republican
Don Chamberlain
73,835
24%
Majority
158,685
52%
Total votes
299,057
100%
Democratic hold
Alabama's 7th congressional district election, 2014
Party
Candidate
Votes
%
Democratic Terri Sewell (Incumbent)
133,687
98%
Write-in
Write-ins
2,212
2%
Majority
131,475
96%
Total votes
135,899
100%
Democratic hold
Alabama's 7th congressional district election, 2016
Party
Candidate
Votes
%
Democratic Terri Sewell (Incumbent)
229,330
98%
No party
Write-ins
3,698
2
Total votes
233,028
100%
Democratic hold
Alabama's 7th congressional district election, 2018[6]
Party
Candidate
Votes
%
Democratic Terri Sewell (Incumbent)
185,010
97%
No party
Write-ins
4,153
2%
Total votes
189,163
100%
Democratic hold