
File:Csch sech coth.svg

Size of this PNG preview of this SVG file: 504 × 504 pixels. Other resolutions: 240 × 240 pixels | 480 × 480 pixels | 768 × 768 pixels | 1,024 × 1,024 pixels | 2,048 × 2,048 pixels.
Original file (SVG file, nominally 504 × 504 pixels, file size: 18 KB)
| This is a file from the Wikimedia Commons. Information from its description page there is shown below. Commons is a freely licensed media file repository. You can help. |
Summary
| Description |
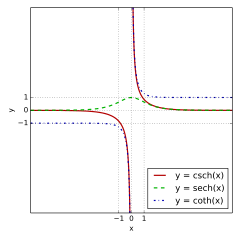
The hyperbolic cosecant (red), hyperbolic secant (green) and hyperbolic cotangent (blue) graphed on the same axes. Replaces Csch sech coth.png.
|
| Date | |
| Source | Own work |
| Author | Fylwind at English Wikipedia |
| SVG development | This plot was created with Matplotlib. |
| Source code | Python codeimport numpy as np
import matplotlib.pyplot as plt
def clip(ys, limit):
return np.ma.masked_where(np.abs(ys) > limit, ys)
lim = 8
size = 5.6
fig, ax = plt.subplots(figsize=(size, size))
xs = np.linspace(-lim, lim, 1000)
ax.plot(xs, clip(1 / np.sinh(xs), lim * 2), label="y = csch(x)",
color="#b30000", linestyle="-", linewidth=2)
ax.plot(xs, 1 / np.cosh(xs), label="y = sech(x)",
color="#00b300", linestyle="--", linewidth=2)
ax.plot(xs, clip(1 / np.tanh(xs), lim * 2), label="y = coth(x)",
color="#0000b3", linestyle="-.", linewidth=2)
ax.set_xlim(-lim, lim)
ax.set_ylim(-lim, lim)
ax.set_xticks([-1, 0, 1])
ax.set_yticks([-1, 0, 1])
ax.set_xlabel("x")
ax.set_ylabel("y")
ax.grid("on")
ax.legend(loc="lower right")
fig.tight_layout()
fig.savefig("csch_sech_coth.svg", transparent=True)
|
Licensing
| I, the copyright holder of this work, release this work into the public domain. This applies worldwide. In some countries this may not be legally possible; if so: I grant anyone the right to use this work for any purpose, without any conditions, unless such conditions are required by law. |
Original upload log
(All user names refer to en.wikipedia)
- 2006-03-14 10:38 Ktims 1600×1200×0 (10563 bytes) The hyperbolic cosecant (red), hyperbolic secant (green) and hyperbolic cotangent (blue) graphed on the same axes.
- 2006-03-14 10:35 Ktims 1600×1200×0 (13176 bytes) The hyperbolic cosecant (red), hyperbolic secant (green) and hyperbolic cotangent (blue) graphed on the same axes.
File history
Click on a date/time to view the file as it appeared at that time.
| Date/Time | Thumbnail | Dimensions | User | Comment | |
|---|---|---|---|---|---|
| current | 23:20, 10 March 2016 | | 504 × 504 (18 KB) | Fylwind | Try again to fix the clipping problem |
| 23:03, 10 March 2016 |  | 504 × 504 (31 KB) | Fylwind | Try to fix SVG clipping bug | |
| 22:53, 10 March 2016 |  | 504 × 504 (22 KB) | Fylwind | Make the asymptotic behavior more evident from the graph. | |
| 00:38, 6 February 2007 |  | 1,600 × 1,200 (15 KB) | Alejo2083 | dashed lines | |
| 00:33, 6 February 2007 |  | 1,600 × 1,200 (10 KB) | Alejo2083 | {{Information |Description=The hyperbolic cosecant (red), hyperbolic secant (green) and hyperbolic cotangent (blue) graphed on the same axes. Replaces en::Image:Csch_sech_coth.png. == Instructions == Generated with en:gnuplot using the script |
File usage
The following 2 pages use this file:
Global file usage
The following other wikis use this file:
- Usage on ar.wikipedia.org
- Usage on az.wikipedia.org
- Usage on ba.wikipedia.org
- Usage on bg.wikipedia.org
- Usage on bs.wikipedia.org
- Usage on ca.wikipedia.org
- Usage on cs.wikipedia.org
- Usage on el.wikipedia.org
- Usage on en.wikipedia.org
- Usage on eo.wikipedia.org
- Usage on eu.wikipedia.org
- Usage on fa.wikipedia.org
- Usage on hi.wikipedia.org
- Usage on hu.wikipedia.org
- Usage on hy.wikipedia.org
- Usage on id.wikipedia.org
- Usage on is.wikipedia.org
- Usage on it.wikipedia.org
- Usage on km.wikipedia.org
- Usage on ko.wikipedia.org
- Usage on mk.wikipedia.org
- Usage on nn.wikipedia.org
- Usage on ro.wikipedia.org
- Usage on ru.wikipedia.org
- Usage on si.wikipedia.org
- Usage on sq.wikipedia.org
- Usage on ta.wikipedia.org
- Usage on tr.wikipedia.org
- Usage on vi.wikipedia.org
- Usage on wuu.wikipedia.org
- Usage on zh.wikipedia.org