
File:English dialects1997.svg

Size of this PNG preview of this SVG file: 269 × 260 pixels. Other resolutions: 248 × 240 pixels | 497 × 480 pixels | 795 × 768 pixels | 1,059 × 1,024 pixels | 2,119 × 2,048 pixels.
Original file (SVG file, nominally 269 × 260 pixels, file size: 12 KB)
| This is a file from the Wikimedia Commons. Information from its description page there is shown below. Commons is a freely licensed media file repository. You can help. |
Summary
| Description |
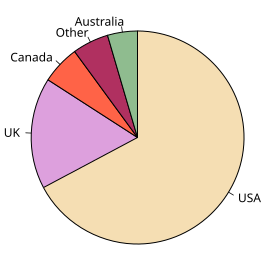
English: Pie chart showing the relative numbers of native English speakers in the major English-speaking countries of the world. |
| Date | |
| Source | Own work, data from English dialects1997.png |
| Author | M. W. Toews |
| Other versions | English dialects1997.png |
| SVG development | |
| Source code | R codedat <- c(USA=226710, UK=56990, Canada=19700, Australia=15316, Other=18581)
col <- c("wheat", "plum", "tomato", "darkseagreen", "maroon")
or <- rev(order(dat))
pdf("English_dialects1997.pdf", height=4, width=4)
par(mar=rep(0,4))
pie(dat[or], init.angle=90, clockwise=TRUE, col=col[or])
dev.off()
|
Licensing
This file is licensed under the Creative Commons Attribution-Share Alike 4.0 International license.
- You are free:
- to share – to copy, distribute and transmit the work
- to remix – to adapt the work
- Under the following conditions:
- attribution – You must give appropriate credit, provide a link to the license, and indicate if changes were made. You may do so in any reasonable manner, but not in any way that suggests the licensor endorses you or your use.
- share alike – If you remix, transform, or build upon the material, you must distribute your contributions under the same or compatible license as the original.
The document was modified slightly in Adobe Illustrator, then re-saved with Inkscape.
| This SVG file shows a very simple image. Drawing uncomplicated graphics with a text editor seems more adequate than using a vector graphics program, and will often result in a dramatic reduction of file size. |
File history
Click on a date/time to view the file as it appeared at that time.
| Date/Time | Thumbnail | Dimensions | User | Comment | |
|---|---|---|---|---|---|
| current | 18:40, 18 October 2020 | | 269 × 260 (12 KB) | Tofeiku | File uploaded using svgtranslate tool (https://svgtranslate.toolforge.org/). Added translation for ms. |
| 19:02, 9 July 2007 |  | 269 × 260 (12 KB) | Mwtoews | == Summary == See Image:English dialects1997.png for information regarding the figure. Created in R, using (roughly): <pre> dat <- c(USA=226710, UK=56990, Canada=19700, Australia=15316, Other=18581) col <- c("wheat", "pl |
File usage
The following page uses this file:
Global file usage
The following other wikis use this file:
- Usage on cs.wikipedia.org
- Usage on en.wikipedia.org
- Usage on en.wikibooks.org
- Usage on en.wikiversity.org
- Usage on es.wikipedia.org
- Usage on hi.wikipedia.org
- Usage on hr.wikipedia.org
- Usage on incubator.wikimedia.org
- Usage on ja.wikipedia.org
- Usage on ko.wikipedia.org
- Usage on no.wikipedia.org
- Usage on pa.wikipedia.org
- Usage on pl.wikipedia.org
- Usage on pl.wiktionary.org
- Usage on sh.wikipedia.org
- Usage on sv.wikibooks.org
- Usage on ta.wikipedia.org
- Usage on tr.wikipedia.org
- Usage on uk.wikipedia.org
- Usage on uz.wikipedia.org
- Usage on zh-yue.wikipedia.org
- Usage on zh.wikipedia.org