
File:Global tropical cyclone tracks.jpg
Size of this preview: 800 × 400 pixels. Other resolutions: 320 × 160 pixels | 640 × 320 pixels | 1,024 × 512 pixels | 1,280 × 640 pixels | 2,560 × 1,280 pixels | 8,000 × 4,000 pixels.
Original file (8,000 × 4,000 pixels, file size: 6.55 MB, MIME type: image/jpeg)
| This is a file from the Wikimedia Commons. Information from its description page there is shown below. Commons is a freely licensed media file repository. You can help. |
| Description |
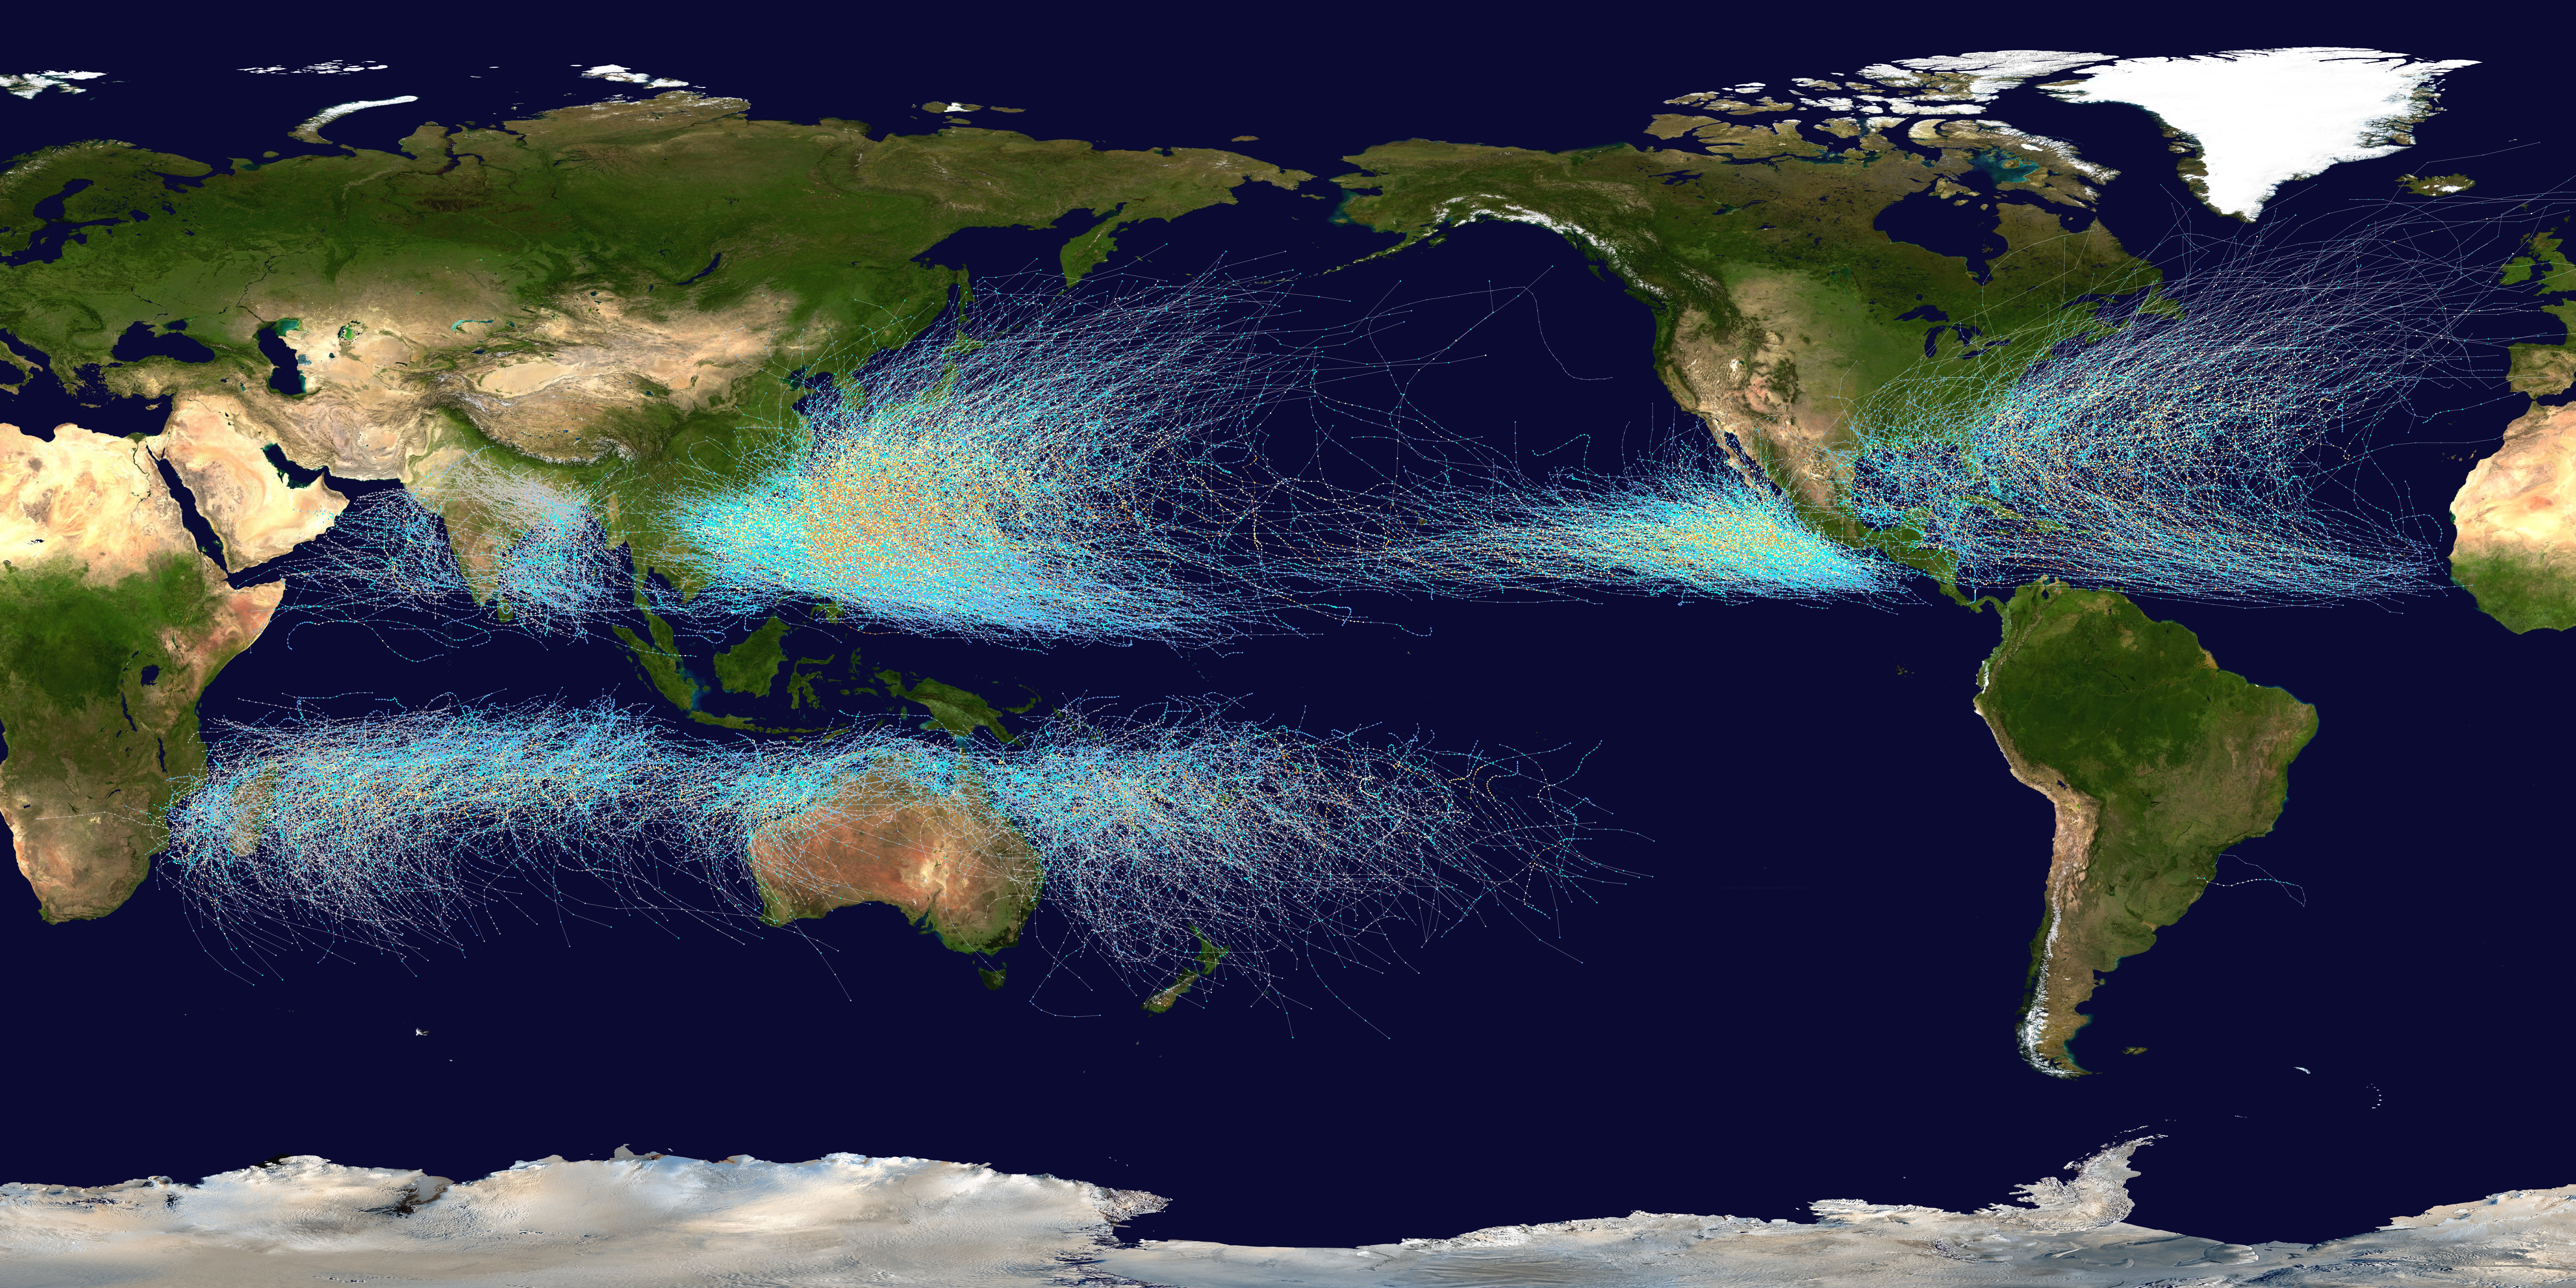
English: This trackmap shows the tracks of all tropical cyclones which formed worldwide from 1950 to 2005.. The points show the location of each storm at 6-hour intervals. The colour represents the storm's maximum sustained wind speeds as classified in the Saffir-Simpson Hurricane Scale (see below), and the shape of the data points represent the nature of the storm.
Tropical depression (≤38 mph, ≤62 km/h)
Tropical storm (39–73 mph, 63–118 km/h)
Category 1 (74–95 mph, 119–153 km/h)
Category 2 (96–110 mph, 154–177 km/h)
Category 3 (111–129 mph, 178–208 km/h)
Category 4 (130–156 mph, 209–251 km/h)
Category 5 (≥157 mph, ≥252 km/h)
Unknown
Storm type |
| Date | 1950–2005 |
| Source | Created using Wikipedia:WikiProject Tropical cyclones/Tracks. The background image is from NASA [1]. The tracking data for the Atlantic and Eastern Pacific basins is taken from the National Hurricane Center and the Central Pacific Hurricane Center's Northeast and North Central Pacific hurricane database. The tracking data for storms in the Indian Ocean, the Northwest Pacific and the Southern Pacific is from the Joint Typhoon Warning Center. Tracking data for Cyclone Catarina in the South Atlantic was published in Gary Padgett's April 2004 Monthly Tropical Cyclone Summary and was originally produced by Roger Edson of the University of Guam. |
| Author | Nilfanion |
Licensing:
| This work has been released into the public domain by its author, Nilfanion. This applies worldwide. In some countries this may not be legally possible; if so: Nilfanion grants anyone the right to use this work for any purpose, without any conditions, unless such conditions are required by law. |
File history
Click on a date/time to view the file as it appeared at that time.
| Date/Time | Thumbnail | Dimensions | User | Comment | |
|---|---|---|---|---|---|
| current | 21:27, 31 July 2006 | | 8,000 × 4,000 (6.55 MB) | Nilfanion | High-resolution version, including Catarina |
| 12:02, 12 July 2006 |  | 8,191 × 4,121 (6.93 MB) | Nilfanion | == Summary == This map shows the tracks of all {{w|Tropical cyclone}}s for which best track data is available. This includes: North Atlantic storms from 1851-2005, East Pacific storms from 1949-2005 and storms from 1945-2005 in all other basins. Uses the |
File usage
The following 2 pages use this file:
Global file usage
The following other wikis use this file:
- Usage on en.wikipedia.org
- Usage on zh.wikipedia.org