
File:Maddison GDP per capita 1500-1950.svg

Size of this PNG preview of this SVG file: 512 × 384 pixels. Other resolutions: 320 × 240 pixels | 640 × 480 pixels | 1,024 × 768 pixels | 1,280 × 960 pixels | 2,560 × 1,920 pixels.
Original file (SVG file, nominally 512 × 384 pixels, file size: 19 KB)
| This is a file from the Wikimedia Commons. Information from its description page there is shown below. Commons is a freely licensed media file repository. You can help. |
Summary
| Description |
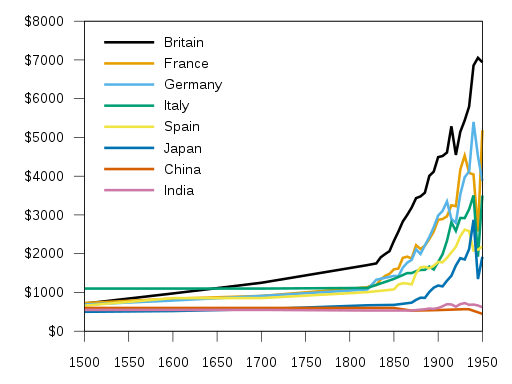
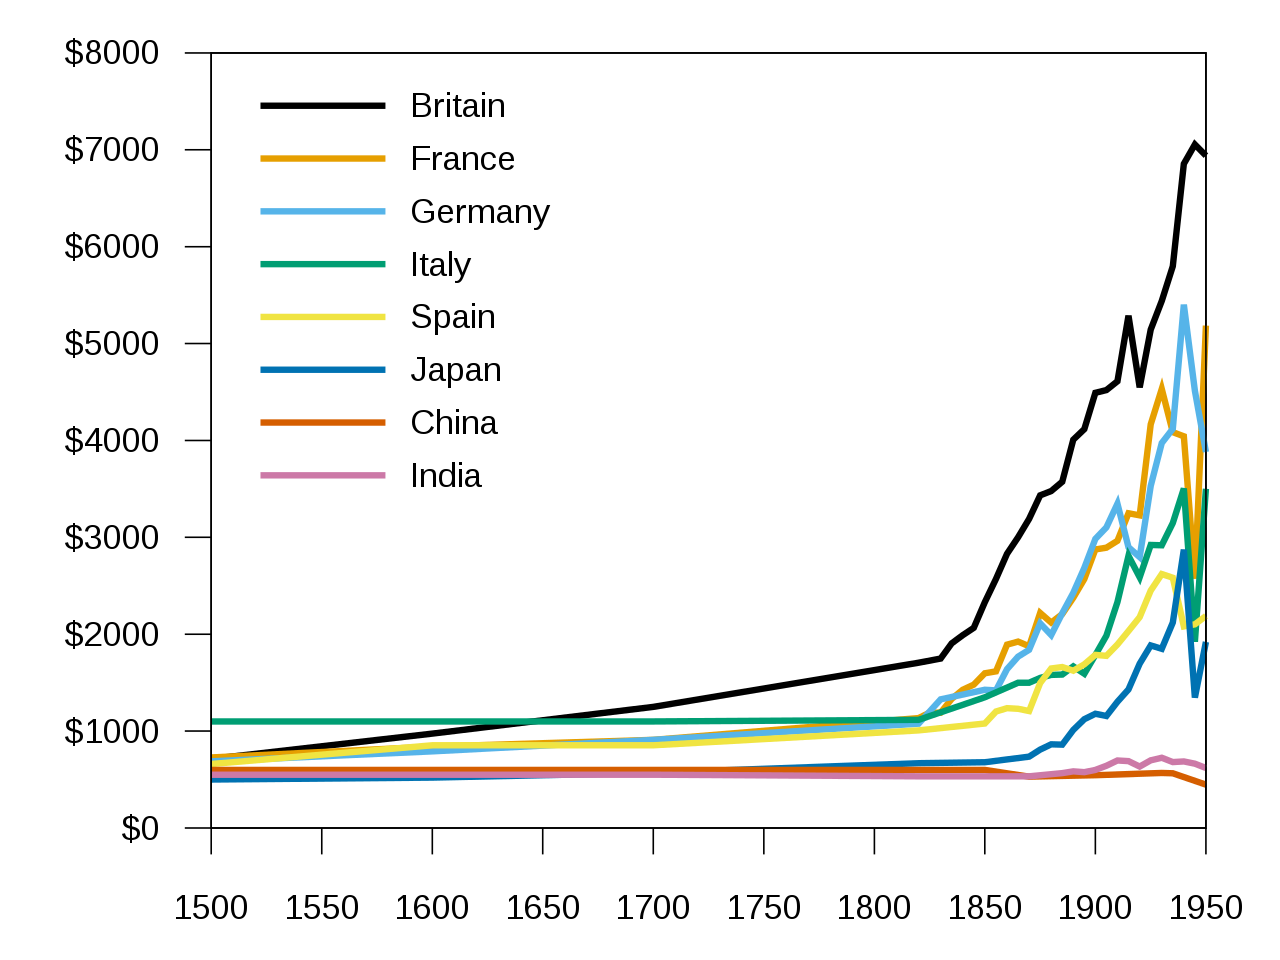
English: Gross domestic product (at purchasing power parity) per capita between 1500 and 1950 in 1990 International Dollars for selected nations, depicting data excerpted from Contours of the World Economy, 1–2030 AD. Essays in Macro-Economic History by Angus Maddison, Oxford University Press, 2007, ISBN 978-0-19-922721-1, p. 382, Table A.7. See also spreadsheets in the Historical Statistics section of Maddison's web page at the University of Groningen. |
| Date | |
| Source | Own work |
| Author | Kanguole |
Licensing
I, the copyright holder of this work, hereby publish it under the following licenses:
This file is licensed under the Creative Commons Attribution-Share Alike 3.0 Unported license.
- You are free:
- to share – to copy, distribute and transmit the work
- to remix – to adapt the work
- Under the following conditions:
- attribution – You must give appropriate credit, provide a link to the license, and indicate if changes were made. You may do so in any reasonable manner, but not in any way that suggests the licensor endorses you or your use.
- share alike – If you remix, transform, or build upon the material, you must distribute your contributions under the same or compatible license as the original.

|
Permission is granted to copy, distribute and/or modify this document under the terms of the GNU Free Documentation License, Version 1.2 or any later version published by the Free Software Foundation; with no Invariant Sections, no Front-Cover Texts, and no Back-Cover Texts. A copy of the license is included in the section entitled GNU Free Documentation License. |
You may select the license of your choice.
File history
Click on a date/time to view the file as it appeared at that time.
| Date/Time | Thumbnail | Dimensions | User | Comment | |
|---|---|---|---|---|---|
| current | 06:38, 10 July 2020 | | 512 × 384 (19 KB) | Sittaco | File uploaded using svgtranslate tool (https://svgtranslate.toolforge.org/). Added translation for ru. |
| 08:44, 13 July 2019 |  | 512 × 384 (17 KB) | Kanguole | Larger font | |
| 08:38, 13 July 2019 |  | 512 × 384 (17 KB) | Kanguole | Add intermediate data points from Maddison's web site; use Gnuplot's "podo" colours for improved accessibility. | |
| 13:19, 21 January 2015 |  | 512 × 320 (14 KB) | Cmglee | Make graphs semitransparent to better show crossings. | |
| 13:09, 17 August 2010 |  | 512 × 320 (14 KB) | Kanguole | thicker lines | |
| 11:23, 13 August 2010 |  | 512 × 320 (14 KB) | Kanguole | adjust aspect ratio | |
| 12:55, 9 August 2010 |  | 512 × 384 (14 KB) | Kanguole | oops, didn't mean to add Russia | |
| 12:53, 9 August 2010 |  | 512 × 384 (15 KB) | Kanguole | thicker lines | |
| 11:37, 28 July 2010 |  | 512 × 384 (14 KB) | Kanguole | add Italy | |
| 15:26, 25 July 2010 |  | 512 × 384 (13 KB) | Kanguole | added dollar signs to y-axis |
File usage
The following page uses this file:
Global file usage
The following other wikis use this file:
- Usage on ar.wikipedia.org
- Usage on az.wikipedia.org
- Usage on de.wikipedia.org
- Usage on en.wikipedia.org
- Usage on en.wikiversity.org
- Usage on he.wikipedia.org
- Usage on hy.wikipedia.org
- Usage on id.wikipedia.org
- Usage on it.wikipedia.org
- Usage on it.wikibooks.org
- Usage on ja.wikipedia.org
- Usage on ko.wikipedia.org
- Usage on pt.wikipedia.org
- Usage on ru.wikipedia.org
- Usage on sh.wikipedia.org
- Usage on tr.wikipedia.org
- Usage on uk.wikipedia.org
- Usage on uz.wikipedia.org
- Usage on vi.wikipedia.org