
New York's 11th congressional district
| New York's 11th congressional district | |||
|---|---|---|---|
 New York 's 11th congressional district since January 3, 2013 | |||
| Representative |
| ||
| Distribution |
| ||
| Population (2019) | 737,390[1] | ||
| Median household income | $81,253[2] | ||
| Ethnicity | |||
| Cook PVI | R+3[3] | ||
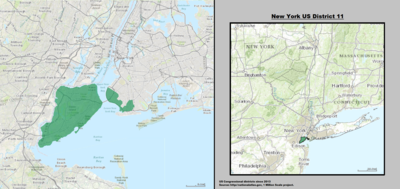
New York's 11th congressional district is a congressional district for the United States House of Representatives in New York City. The 11th district includes all of Staten Island and areas of Brooklyn. The district is currently represented by Republican Nicole Malliotakis who was elected in 2020. The district used to be represented by Democrat Max Rose but was on of the few districts that changed to Republican in the 2020 elections.
Election history[change | change source]
| Election results from presidential races | ||
|---|---|---|
| Year | Office | Results |
| 2012 | President | Obama 52 - 47% |
| 2016 | President | Trump 54 - 44% |
| 2020 | President | Trump 55 - 44% |
| 1996 election | |||||
|---|---|---|---|---|---|
| Party | Candidate | Votes | % | ±% | |
| Democratic | Major Owens | 89,905 | 92.0 | ||
| Republican | Claudette Hayle | 7,866 | 8.0 | ||
| Majority | 82,039 | 83.9 | |||
| Turnout | 97,771 | ||||
| 1998 election | |||||
|---|---|---|---|---|---|
| Party | Candidate | Votes | % | ±% | |
| Democratic | Major Owens | 75,773 | 90.0 | -2.0 | |
| Republican | David Greene | 7,284 | 8.7 | +0.7 | |
| Independence | Phyllis Taliaferro | 1,144 | 1.4 | +1.4 | |
| Majority | 68,489 | 81.3 | -2.6 | ||
| Turnout | 84,201 | -13.9 | |||
| 2000 election | |||||
|---|---|---|---|---|---|
| Party | Candidate | Votes | % | ±% | |
| Democratic | Major Owens | 112,050 | 87.0 | -3.0 | |
| Republican | Susan Cleary | 8,406 | 6.5 | -2.2 | |
| Liberal | Una S.T. Clarke | 7,366 | 5.7 | +5.7 | |
| Conservative | Cartrell Gore | 962 | 0.7 | +0.7 | |
| Majority | 103,644 | 80.5 | -0.8 | ||
| Turnout | 128,784 | +52.9 | |||
| 2002 election | |||||
|---|---|---|---|---|---|
| Party | Candidate | Votes | % | ±% | |
| Democratic | Major Owens | 76,917 | 86.6 | -0.4 | |
| Republican | Susan Cleary | 11,149 | 12.5 | +6.0 | |
| Conservative | Alice Gaffney | 798 | 0.9 | +0.2 | |
| Majority | 65,768 | 74.0 | -6.5 | ||
| Turnout | 88,864 | -31.0 | |||
| 2004 election | |||||
|---|---|---|---|---|---|
| Party | Candidate | Votes | % | ±% | |
| Democratic | Major Owens | 144,999 | 94.0 | +7.4 | |
| Independence | Lorraine Stevens | 4,721 | 3.1 | +3.1 | |
| Conservative | Sol Lieberman | 4,478 | 2.9 | +2.0 | |
| Majority | 140,278 | 91.0 | +17.0 | ||
| Turnout | 154,198 | +73.5 | |||
| 2006 election | |||||
|---|---|---|---|---|---|
| Party | Candidate | Votes | % | ±% | |
| Democratic | Yvette Clarke | 88,334 | 90.0 | -4.0 | |
| Republican | Stephen Finger | 7,447 | 7.6 | +7.6 | |
| Conservative | Marianna Blume | 1,325 | 1.4 | -1.5 | |
| Freedom | Ollie M. McClean | 996 | 1.0 | +1.0 | |
| Majority | 80,887 | 82.5 | -8.5 | ||
| Turnout | 98,102 | -36.4 | |||
| 2008 election | |||||
|---|---|---|---|---|---|
| Party | Candidate | Votes | % | ±% | |
| Democratic | Yvette Clarke | 168,562 | 92.8 | +2.8 | |
| Republican | Hugh C. Carr | 11,644 | 6.4 | -1.2 | |
| Conservative | Cartrell Gore | 1,517 | 0.8 | -0.6 | |
| Majority | 156,918 | 86.4 | +3.9 | ||
| Turnout | 181,723 | +85.2 | |||
| 2010 election | |||||
|---|---|---|---|---|---|
| Party | Candidate | Votes | % | ±% | |
| Democratic | Yvette Clarke | 104,297 | 90.6 | -2.2 | |
| Republican | Hugh C. Carr | 10,858 | 9.4 | +3.0 | |
| Majority | 93,439 | 81.1 | -5.3 | ||
| Turnout | 115,155 | -36.6 | |||
| 2015 special election | |||||
|---|---|---|---|---|---|
| Party | Candidate | Votes | % | ±% | |
| Republican | Daniel M. Donovan | 23,409 | 58.7 | ||
| Democratic | Vincent Gentile | 15,808 | 39.4 | ||
| Turnout | 42,569 | ||||
| 2016 election | |||||
|---|---|---|---|---|---|
| Party | Candidate | Votes | % | ±% | |
| Republican | Daniel M. Donovan | 134,366 | 62.2 | ||
| Democratic | Richard Reichard | 78,066 | 36.1 | ||
| Turnout | 216,023 | ||||
| 2018 election | ||||||
|---|---|---|---|---|---|---|
| Party | Candidate | Votes | % | ±% | ||
| Democratic | Max Rose | 101,823 | 53.0 | |||
| Republican | Daniel M. Donovan (Incumbent) | 89,441 | 46.6 | |||
| Democratic gain from Republican | ||||||
| 2020 election[4] | |||||
|---|---|---|---|---|---|
| Party | Candidate | Votes | % | ±% | |
| Republican | Nicole Malliotakis | 155,608 | 53.2 | +6.4 | |
| Democratic | Max Rose (Incumbent) | 137,198 | 46.8 | -6.2 | |
| Republican gain from Democratic | Swing | +12.6 | |||
References[change | change source]
- ↑ "New York congressional districts by urban and rural population and land area". United States Census Bureau. June 8, 2017. Archived from the original on November 21, 2019. Retrieved November 21, 2019.
- ↑ "My Congressional District".
- ↑ "Partisan Voting Index – Districts of the 115th Congress" (PDF). The Cook Political Report. April 7, 2017. Archived from the original (PDF) on June 7, 2017. Retrieved April 7, 2017.
- ↑ "General Election Results - Certified December 03, 2020". New York State Board of Elections. Archived from the original on January 15, 2021. Retrieved December 17, 2020.