
New York's 20th congressional district
| New York's 20th congressional district | |||
|---|---|---|---|
 New York's 20th congressional district since January 3, 2013 | |||
| Representative |
| ||
| Distribution |
| ||
| Population (2019) | 725,669 | ||
| Median household income | $71,156[1] | ||
| Cook PVI | D+7[2] | ||
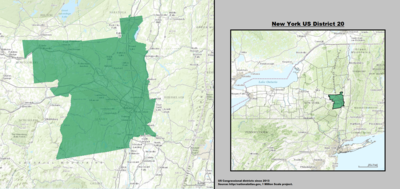
New York's 20th congressional district is a congressional district for the United States House of Representatives located in the middle of New York. It includes all of Albany and Schenectady counties, and parts of Montgomery, Rensselaer, and Saratoga counties. Democrat Paul Tonko represents the district since 2013.
Election history[change | change source]
| Year | Office | Results |
|---|---|---|
| 1992 | President | Clinton 45 - 41% |
| 1996 | President | Clinton 54 - 37% |
| 2000 | President | Bush 51 - 44% |
| 2004 | President | Bush 54 - 46% |
| 2008 | President | Obama 51 - 46% |
| 2012 | President | Obama 59.2 - 38.8% |
| 2016 | President | Clinton 54.0 - 40.5% |
| 1996 United States House of Representatives elections in New York's 20th district | |||||
|---|---|---|---|---|---|
| Party | Candidate | Votes | % | ±% | |
| Republican | Benjamin A. Gilman | 122,479 | 57.1% | ||
| Democratic | Yash A. Aggarwal | 80,761 | 37.6% | ||
| Right to Life | Robert F. Garrison | 6,356 | 3.0% | ||
| Independence | Ira W. Goodman | 5,016 | 2.3% | ||
| Majority | 41,718 | 19.4% | |||
| Turnout | 214,612 | 100% | |||
| 1998 United States House of Representatives elections in New York's 20th district | |||||
|---|---|---|---|---|---|
| Party | Candidate | Votes | % | ±% | |
| Republican | Benjamin A. Gilman | 98,546 | 58.3% | +1.2% | |
| Democratic | Paul J. Feiner | 65,589 | 38.8% | +1.2% | |
| Right to Life | Christine M. Tighe | 4,769 | 2.8% | -0.2% | |
| Majority | 32,957 | 19.5% | +0.1% | ||
| Turnout | 168,904 | 100% | -21.3% | ||
| 2000 United States House of Representatives elections in New York's 20th district | |||||
|---|---|---|---|---|---|
| Party | Candidate | Votes | % | ±% | |
| Republican | Benjamin A. Gilman | 136,016 | 57.6% | -0.7% | |
| Democratic | Paul J. Feiner | 94,646 | 40.1% | +1.3% | |
| Right to Life | Christine M. Tighe | 5,371 | 2.3% | -0.5% | |
| Majority | 41,370 | 17.5% | -2.0% | ||
| Turnout | 236,033 | 100% | +39.7% | ||
| 2002 United States House of Representatives elections in New York's 20th district | |||||
|---|---|---|---|---|---|
| Party | Candidate | Votes | % | ±% | |
| Republican | John E. Sweeney | 140,238 | 73.3% | +15.7% | |
| Democratic | Frank Stoppenbach | 45,878 | 24.0% | -16.1% | |
| Green | Margaret Lewis | 5,162 | 2.7% | +2.7% | |
| Majority | 94,360 | 49.3% | +31.8% | ||
| Turnout | 191,278 | 100% | -19.0% | ||
| 2004 United States House of Representatives elections in New York's 20th district | |||||
|---|---|---|---|---|---|
| Party | Candidate | Votes | % | ±% | |
| Republican | John E. Sweeney | 188,753 | 65.8% | -7.5% | |
| Democratic | Doris F. Kelly | 96,630 | 33.7% | +9.7% | |
| Centrist Party | Morris N. Guller | 1,353 | 0.5% | +0.5% | |
| Majority | 92,123 | 32.1% | -17.2% | ||
| Turnout | 286,736 | 100% | +49.9% | ||
| 2006 United States House of Representatives elections in New York's 20th district | |||||
|---|---|---|---|---|---|
| Party | Candidate | Votes | % | ±% | |
| Democratic | Kirsten Gillibrand | 125,168 | 53.1% | +19.4% | |
| Republican | John E. Sweeney | 110,554 | 46.9% | -18.9% | |
| Majority | 14,614 | 6.2% | -25.9% | ||
| Turnout | 235,722 | 100% | -17.8% | ||
| 2008 United States House of Representatives elections in New York's 20th district[3] | |||||
|---|---|---|---|---|---|
| Party | Candidate | Votes | % | ±% | |
| Democratic | Kirsten Gillibrand | 177,677 | 61.8% | +8.7% | |
| Republican | Sandy Treadwell | 109,644 | 38.2% | -8.7% | |
| Majority | 68,033 | 23.6% | +17.4% | ||
| Turnout | 287,321 | 100% | +21.9% | ||
| 2009 New York's 20th congressional district special election[4] | |||||
|---|---|---|---|---|---|
| Party | Candidate | Votes | % | ±% | |
| Democratic | Scott Murphy | 80,833 | 50.23% | -11.57% | |
| Republican | James Tedisco | 80,107 | 49.77% | +11.57% | |
| Majority | 726 | 0.45% | -23.15% | ||
| Turnout | 160,940 | 100% | -44.0% | ||
| 2010 United States House of Representatives elections in New York's 20th district[5] | |||||
|---|---|---|---|---|---|
| Party | Candidate | Votes | % | ±% | |
| Republican | Chris Gibson | 130,176 | 54.87% | +5.10% | |
| Democratic | Scott Murphy | 107,077 | 45.13% | -5.10% | |
| Majority | 23,099 | 9.74% | +9.29% | ||
| Turnout | 237,253 | 100% | +47.4% | ||
| 2012 United States House of Representatives elections in New York's 20th district[6] | |||||
|---|---|---|---|---|---|
| Party | Candidate | Votes | % | ±% | |
| Democratic | Paul Tonko | 203,401 | 68.44% | +23.3% | |
| Republican | Robert J. Dieterich | 93,778 | 31.56% | -23.3% | |
| Majority | 109,623 | 36.89% | +27.2% | ||
| Turnout | 313,024 | 100% | +31.93% | ||
| 2014 United States House of Representatives elections in New York's 20th district[7] | |||||
|---|---|---|---|---|---|
| Party | Candidate | Votes | % | ±% | |
| Democratic | Paul Tonko | 125,111 | 61.26% | -7.18% | |
| Republican | James M. Fischer | 79,104 | 38.74% | +7.18% | |
| Majority | 46007 | 22.53% | -14.36% | ||
| Turnout | 171,118 | 100% | -45.33% | ||
| 2016 United States House of Representatives elections in New York's 20th district[8] | |||||
|---|---|---|---|---|---|
| Party | Candidate | Votes | % | ±% | |
| Democratic | Paul Tonko | 213,018 | 67.89% | +6.63% | |
| Republican | Joe Vitollo | 100,740 | 32.11% | -6.63% | |
| Majority | 112,278 | 35.78% | +13.25% | ||
| Turnout | 325,296 | 100% | +90.10% | ||
| 2018 United States House of Representatives elections in New York's 20th district[9] | |||||
|---|---|---|---|---|---|
| Party | Candidate | Votes | % | ±% | |
| Democratic | Paul Tonko | 176,811 | 66.50% | -1.39% | |
| Republican | Joe Vitollo | 89,058 | 33.50% | +1.39% | |
| Majority | 87,753 | 33.01% | -2.77% | ||
| Turnout | 264,564 | 100% | -18.67% | ||
References[change | change source]
- ↑ Center for New Media & Promotion (CNMP), US Census Bureau. "My Congressional District". www.census.gov.
- ↑ "Partisan Voting Index – Districts of the 115th Congress" (PDF). The Cook Political Report. April 7, 2017. Archived (PDF) from the original on June 7, 2017. Retrieved April 7, 2017.
- ↑ Neuman, William (November 5, 2008). "Election Results 2008: New York". New York Times. Archived from the original on December 17, 2008. Retrieved December 6, 2008.
- ↑ "Statement of Canvass: 20th Congressional District" (PDF). New York State Board of Elections. May 2009. Archived (PDF) from the original on November 5, 2013. Retrieved May 15, 2009.
- ↑ "Archived copy" (PDF). Archived (PDF) from the original on August 23, 2012. Retrieved July 24, 2012.
{{cite web}}: CS1 maint: archived copy as title (link) 2010 election results - ↑ "NYS Board of Elections Rep. in Congress Election Returns Nov. 6, 2012" (PDF). Archived from the original (PDF) on December 22, 2020. Retrieved June 4, 2020. 2012 election results
- ↑ "NYS Board of Elections Rep. in Congress Election Returns November 4, 2014" (PDF). Archived from the original (PDF) on May 4, 2020. Retrieved June 4, 2020. 2014 election results
- ↑ "NYS Board of Elections Rep. in Congress Election Returns Nov. 8, 2016" (PDF). Archived from the original (PDF) on May 19, 2017. Retrieved June 4, 2020. 2016 election results
- ↑ "Certified Results from the November 6, 2018 General Election for U.S. Congress" (PDF). Archived from the original (PDF) on January 4, 2019. Retrieved June 4, 2020. 2018 election results