From Simple English Wikipedia, the free encyclopedia
| South Carolina's 7th congressional district |
|---|
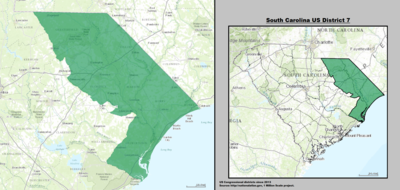 South Carolina's 7th congressional district since January 3, 2013 |
| Representative | |
|---|
| Population (2019) | 740,536 |
|---|
Median household
income | $49,494[1] |
|---|
| Ethnicity | |
|---|
| Cook PVI | R+9[2] |
|---|
South Carolina's 7th congressional district is a congressional district in the state of South Carolina. The district was created in 1803 but was removed in 1933. The district was then created again in 2013. The district includes the counties of Chesterfield, Dillon, Georgetown, Horry, Marlboro, Darlington, and Marion and parts of Florence county. The current representative for the district is Republican Tom Rice.
- ↑ "My Congressional District".
- ↑ "Partisan Voting Index – Districts of the 115th Congress" (PDF). The Cook Political Report. April 7, 2017. Archived from the original (PDF) on April 13, 2017. Retrieved April 7, 2017.
- ↑ "Election Statistics - US House of Representatives: History, Art & Archives". Karen Haas, Clerk of the United States House of Representatives. Retrieved February 23, 2013.
- ↑ "South Carolina Election Commission Official Results". West Virginia Secretary of State. November 4, 2014. Retrieved January 8, 2015.
- ↑ "2016 Statewide General Election official results". South Carolina State Election Commission. Retrieved December 5, 2016.
- ↑ "2020 Statewide General Election Night Reporting - Results". South Carolina Election Commission. November 10, 2020. Retrieved November 11, 2020.


