
2008 United States presidential election
| |||||||||||||||||||||||||||||
All 538 electoral votes of the Electoral College 270 electoral votes needed to win | |||||||||||||||||||||||||||||
|---|---|---|---|---|---|---|---|---|---|---|---|---|---|---|---|---|---|---|---|---|---|---|---|---|---|---|---|---|---|
| Turnout | 58.2%[1] | ||||||||||||||||||||||||||||
| |||||||||||||||||||||||||||||
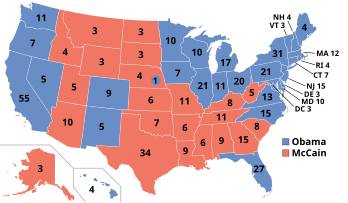 Presidential election results map. Blue denotes those won by Obama/Biden, red denotes states won by McCain/Palin. Numbers indicate electoral votes allotted to the winner of each state. | |||||||||||||||||||||||||||||
| |||||||||||||||||||||||||||||

The 2008 United States presidential election happened on November 4, 2008. Barack Obama, the Democratic candidate and junior U.S. Senator from Illinois, won the election. He defeated John McCain, the Republican candidate, who was the senior U.S. Senator from Arizona. Obama's victory in this election made him the first African-American president.
Incumbent Republican President George W. Bush was not eligible to serve a third term by law. McCain secured the Republican nomination by March 2008, defeating former governors Mitt Romney, Mike Huckabee, and other challengers. Obama secured the Democratic nomination in June 2008, after facing strong competition against former First Lady and Senator from New York Hillary Clinton. Clinton's victory in the New Hampshire primary made her the first woman to win a major party's presidential primary.
Obama won a decisive victory over McCain. He won states that had not voted for the Democratic presidential candidate since 1964 (Indiana and Virginia) and 1976 (North Carolina). Obama won nine states that had voted Republican in 2004: Colorado, Florida, Indiana, Iowa, Nevada, New Mexico, North Carolina, Ohio, and Virginia, as well as Nebraska's 2nd congressional district. He received the largest share of the popular vote won by a Democrat since Lyndon B. Johnson in 1964 and was the first Democrat to win an outright majority of the popular vote since Jimmy Carter in 1976. Obama won 69.5 million votes, the most ever won by a presidential candidate; this total would be surpassed in 2020 by both Joe Biden and Donald Trump.
Background[change | change source]
Article Two of the United States Constitution provides that for a person to be elected and serve as President of the United States, the individual must be a natural-born citizen of the United States, at least 35 years old, and a resident of the United States for a period of no less than 14 years.
Candidates for the presidency typically seek the nomination of one of the various political parties of the United States, in which case each party devises a method (such as a primary election) to choose the candidate the party deems best suited to run for the position. The party's delegates then officially nominate a candidate to run on the party's behalf.
President George W. Bush was unable to seek re-election for a third term because of the Twenty-second Amendment to the United States Constitution, which states that a president may only serve up to two terms. His term as president ended at noon eastern standard time on January 20, 2009.
Democratic Primaries[change | change source]
The candidates running for the nomination of the Democratic Party were Barack Obama, Hillary Clinton, John Edwards, Joe Biden, Dennis Kucinich, Mike Gravel, Chris Dodd, and Bill Richardson.
The main contest during the Democratic primaries was between Barack Obama and Hillary Clinton, which was a very close race. Clinton won the popular vote, but ultimately Obama won more unpledged delegates and therefore the nomination.
All candidates except Mike Gravel, who switched to the Libertarian Party during the election, supported Barack Obama.
Barack Obama chose Joe Biden as the vice-presidential candidate on August 23, 2008.
Nominees[change | change source]
| Barack Obama | Joe Biden | ||||||||||||||||||||||||||||
|---|---|---|---|---|---|---|---|---|---|---|---|---|---|---|---|---|---|---|---|---|---|---|---|---|---|---|---|---|---|
| for President | for Vice President | ||||||||||||||||||||||||||||
 |
 | ||||||||||||||||||||||||||||
| U.S. Senator from Illinois (2005–incumbent) |
U.S. Senator from Delaware (1973–incumbent) | ||||||||||||||||||||||||||||
| Campaign | |||||||||||||||||||||||||||||
Withdrawn candidates[change | change source]
- Hillary Clinton, retired lawyer and wife of Bill Clinton
- John Edwards, retired U.S. Senator from North Carolina (withdrew on January 30, 2008, and endorsed Barack Obama)
- Bill Richardson, Governor of New Mexico (withdrew on January 10, 2008, and endorsed Barack Obama)
- Dennis Kucinich, U.S. Representative from Ohio (withdrew on January 24, 2008, and endorsed Barack Obama)
- Joe Biden, U.S. Senator from Delaware (withdrew on January 3, 2008 and endorsed Barack Obama)
- Mike Gravel, former U.S. Senator from Alaska (withdrew on March 25, 2008, to run for the Libertarian Party nomination. After losing the nomination, he endorsed Jesse Johnson)
- Christopher Dodd, U.S. Senator from Connecticut (withdrew on January 3, 2008, and endorsed Barack Obama)
- Evan Bayh, U.S. Senator from Indiana (withdrew on December 15, 2006, and endorsed Hillary Clinton. He later endorsed Barack Obama)
- Tom Vilsack, former Governor of Iowa (withdrew on February 23, 2007, and endorsed Hillary Clinton. He later endorsed Barack Obama)


Republican Primaries[change | change source]
The candidates running for the nomination of the Republican Party were John McCain, Mitt Romney, Mike Huckabee, Ron Paul, Rudy Giuliani, Fred Thompson, Tom Tancredo, Alan Keyes, Jim Gilmore, Sam Brownback, and Duncan Hunter.
Republican President George W. Bush was unable to run for re-election since a president is only able to be elected twice. Vice president Dick Cheney chose not to run.
Most of the candidates withdrew early. As a result, John McCain, Mike Huckabee, and Mitt Romney emerged as the three people most likely to win the nomination. Ron Paul became popular among libertarians.
John McCain was nominated by the Republican Party (by a decisive victory).
He chose Sarah Palin as the vice-presidential candidate.
Nominees[change | change source]
 | |||||||||||||||||||||||||||||
| John McCain | Sarah Palin | ||||||||||||||||||||||||||||
|---|---|---|---|---|---|---|---|---|---|---|---|---|---|---|---|---|---|---|---|---|---|---|---|---|---|---|---|---|---|
| for President | for Vice President | ||||||||||||||||||||||||||||
 |
 | ||||||||||||||||||||||||||||
| U.S. Senator from Arizona (1987–2018) |
9th Governor of Alaska (2006–2009) | ||||||||||||||||||||||||||||
| Campaign | |||||||||||||||||||||||||||||
Withdrawn candidates[change | change source]
- Mitt Romney, former Governor of Massachusetts (withdrew on February 7, 2008, and endorsed John McCain)
- Mike Huckabee, former Governor of Arkansas (withdrew on March 4, 2008, and endorsed John McCain)
- Ron Paul, U.S. Representative from Texas (withdrew on June 12, 2008, and endorsed Chuck Baldwin)
- Rudy Giuliani, former Mayor of New York City (withdrew on January 30, 2008, and endorsed John McCain)
- Fred Thompson, former U.S. Senator from Tennessee (withdrew on January 22, 2008, and endorsed John McCain)
- Alan Keyes, former U.S. ECOSOC Ambassador from Maryland (withdrew on April 15, 2008, to run for the Constitution Party nomination. After losing that nomination, he ran as the America's Independent Party nominee.)
- Duncan Hunter, U.S. Representative from California (withdrew on January 19, 2008, and endorsed Mike Huckabee. He later endorsed John McCain)
- Tom Tancredo, U.S. Representative from Colorado (withdrew on December 20, 2007, and endorsed Mitt Romney. He later endorsed John McCain)
- Sam Brownback, U.S. Senator from Kansas (withdrew on October 18, 2007, and endorsed John McCain)
- Tommy Thompson, former United States Secretary of Health and Human Services (withdrew on August 12, 2007, and endorsed Rudy Giuliani. He later endorsed John McCain)
- Jim Gilmore, former Governor of Virginia (withdrew on July 14, 2007, and endorsed John McCain)


The Campaign[change | change source]
The biggest issue during the campaign was the bad economy. Other issues included health care, the Iraq War, the war on terrorism, and energy independence.
The president during the election, George W. Bush (who eventually supported John McCain), was very unpopular due to the 2007-09 Great Recession, and because of that, the Obama campaign compared McCain to Bush several times.
There were four television debates during the campaign: three of them were between the two presidential candidates, and one of them was between the two vice-presidential candidates.
Results[change | change source]
| Candidate | Votes | % | States led | National ECV |
|---|---|---|---|---|
| Barack Obama (Democrat) |
69,498,516 | 52.9% | 28+DC+NE-02* | 365 |
| John McCain (Republican) | 59,948,323 | 45.7% | 22 | 173 |
| Ralph Nader (Independent) | 739,034 | 0.56% | 0 | 0 |
| Bob Barr (Libertarian) | 523,715 | 0.40% | 0 | 0 |
| Chuck Baldwin (Constitution) | 199,750 | 0.15% | 0 | 0 |
| Cynthia McKinney (Green) | 161,797 | 0.12% | 0 | 0 |
| Alan Keyes (Independent) | 47,746 | 0.04% | 0 | 0 |
| Roger Calero (Socalist Workers) | 7,575 | 0.01% | 0 | 0 |
| Gloria La Riva (Socialism and Liberation) | 6,808 | 0.01% | 0 | 0 |
| Brian Moore (USA Socialist) | 6,528 | 0.01% | 0 | 0 |
| Charles Jay (Boston Tea) | 2,422 | 0.00% | 0 | 0 |
| Frank McCenulty (New American Indpendent) | 828 | 0.00% | 0 | 0 |
| Tom Stevens (Objectivist) | 755 | 0.00% | 0 | 0 |
| Gene Amondson (Prohibition) | 653 | 0.00% | 0 | 0 |
| Ted Weill (Reform) | 481 | 0.00% | 0 | 0 |
| Total | 131,313,820 | 100.00% | 50 + DC | 538 |
*NE-02 is Nebraska's 2nd Congressional District.
Results by state[change | change source]
| State | Obama Popular Vote | Obama % | McCain Popular Vote | McCain % | Electoral Vote |
|---|---|---|---|---|---|
| Alabama | 813,479 | 38.74% | 1,266,546 | 60.32% | 9 |
| Alaska | 123,594 | 37.89% | 193,841 | 59.42% | 3 |
| Arizona | 1,034,707 | 45.12% | 1,230,111 | 53.64% | 10 |
| Arkansas | 422,310 | 38.86% | 638,017 | 58.72% | 6 |
| California | 8,274,473 | 61.01% | 5,011,781 | 36.95% | 55 |
| Colorado | 1,288,633 | 53.66% | 1,073,629 | 44.71% | 9 |
| Connecticut | 997,772 | 60.59% | 629,428 | 38.22% | 7 |
| Delaware | 255,429 | 61.94% | 152,374 | 36.95% | 3 |
| District of Columbia | 245,800 | 92.46% | 17,367 | 6.53% | 3 |
| Florida | 4,282,074 | 51.03% | 4,045,624 | 48.22% | 27 |
| Georgia | 1,844,123 | 46.99% | 2,048,759 | 52.20% | 15 |
| Hawaii | 325,871 | 71.85% | 120,566 | 26.58% | 4 |
| Idaho | 236,440 | 36.09% | 403,012 | 61.52% | 4 |
| Illinois | 3,419,308 | 61.92% | 2,031,179 | 36.78% | 21 |
| Indiana | 1,374,039 | 49.95% | 1,345,648 | 48.91% | 11 |
| Iowa | 828,940 | 53.93% | 682,379 | 44.39% | 7 |
| Kansas | 514,765 | 41.95% | 699,655 | 56.61% | 6 |
| Kentucky | 751,985 | 41.17% | 1,048,462 | 57.40% | 8 |
| Louisiana | 782,989 | 39.93% | 1,148,275 | 58.56% | 9 |
| Maine | 421,923 | 57.71% | 295,273 | 40.38% | 4 |
| Maryland | 1,629,467 | 61.92% | 959,862 | 36.47% | 10 |
| Massachusetts | 1,904,097 | 61.80% | 1,108,854 | 35.99% | 12 |
| Michigan | 2,872,579 | 57.43% | 2,048,639 | 40.96% | 17 |
| Minnesota | 1,573,354 | 54.06% | 1,275,409 | 43.82% | 10 |
| Mississippi | 554,662 | 43.00% | 724,597 | 56.18% | 6 |
| Missouri | 1,441,911 | 49.29% | 1,445,814 | 49.43% | 11 |
| Montana | 231,667 | 47.25% | 242,763 | 49.51% | 3 |
| Nebraska | 333,319 | 41.60% | 452,479 | 56.53% | 5** |
| Nevada | 533,736 | 55.15% | 412,827 | 42.65% | 5 |
| New Hampshire | 384,826 | 54.13% | 316,534 | 44.52% | 4 |
| New Jersey | 2,215,422 | 57.27% | 1,613,207 | 41.70% | 15 |
| New Mexico | 472,422 | 56.91% | 346,832 | 41.78% | 5 |
| New York | 4,804,945 | 62.88% | 2,752,771 | 36.03% | 31 |
| North Carolina | 2,142,651 | 49.70% | 2,128,474 | 49.38% | 15 |
| North Dakota | 141,278 | 44.62% | 168,601 | 53.25% | 3 |
| Ohio | 2,940,044 | 51.50% | 2,677,820 | 46.91% | 20 |
| Oklahoma | 502,496 | 34.35% | 960,165 | 65.65% | 7 |
| Oregon | 1,037,291 | 56.75% | 738,475 | 40.40% | 7 |
| Pennsylvania | 3,276,363 | 54.49% | 2,655,885 | 44.17% | 21 |
| Rhode Island | 296,571 | 62.86% | 165,391 | 35.06% | 4 |
| South Carolina | 862,449 | 44.90% | 1,034,896 | 53.87% | 8 |
| South Dakota | 170,924 | 44.75% | 203,054 | 53.16% | 3 |
| Tennessee | 1,087,437 | 41.83% | 1,479,178 | 56.90% | 11 |
| Texas | 3,528,633 | 43.68% | 4,479,328 | 55.45% | 34 |
| Utah | 327,670 | 34.41% | 596,030 | 62.58% | 5 |
| Vermont | 219,262 | 67.46% | 98,974 | 30.45% | 3 |
| Virginia | 1,959,532 | 52.63% | 1,725,005 | 46.33% | 13 |
| Washington | 1,750,848 | 57.65% | 1,229,216 | 40.48% | 11 |
| West Virginia | 303,857 | 42.59% | 397,466 | 55.71% | 5 |
| Wisconsin | 1,677,211 | 56.22% | 1,262,393 | 42.31% | 10 |
| Wyoming | 82,868 | 32.54% | 164,958 | 64.78% | 3 |
**Nebraska cast 4 ECVs for McCain and 1 for Obama.
Related pages[change | change source]
- Joe the Plumber, political activist and stereotype
References[change | change source]
- ↑ "Official 2008 Presidential General Election Results" (PDF). fec.gov. Retrieved 2017-03-31.
Other websites[change | change source]
| Authority control: National |
|---|