Roswell, New Mexico
Roswell, New Mexico | |
|---|---|
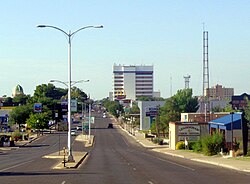
 Skyline of Roswell, looking south along Main St. | |
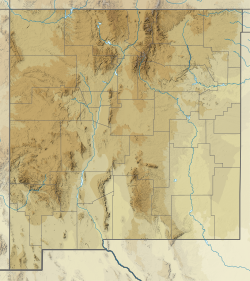
 Location within Chaves County | |
| Coordinates: 33°23′14″N 104°31′41″W / 33.38722°N 104.52806°W | |
| Country | |
| State | New Mexico |
| County | Chaves |
| Area | |
| • Total | 29.78 sq mi (77.12 km2) |
| • Land | 29.72 sq mi (76.96 km2) |
| • Water | 0.06 sq mi (0.16 km2) |
| Elevation | 3,573 ft (1,089 m) |
| Population | |
| • Total | 48,422 |
| • Density | 1,629.49/sq mi (629.14/km2) |
| Time zone | UTC−07:00 (Mountain) |
| • Summer (DST) | UTC−06:00 (DST) |
| ZIP Codes | 88201-88203 |
| Area code | 575 |
| FIPS code | 35-64930 |
| GNIS feature ID | 0894171 |
| Website | www |
Roswell is a city in the U.S. state of New Mexico. It is famous for the 1947 Roswell UFO Incident. It is also the home of New Mexico Military Institute (NMMI), which was founded in 1891.
Geography[change | change source]
Roswell is located in the High Great Plains of southeastern New Mexico,[3] approximately 7 mi (11 km) west of the Pecos River and some 40 mi (64 km) east of highlands that rise to the Sierra Blanca range. U.S. Routes 70, 285 and 380 intersect in the city. US 70 leads northeast 111 mi (179 km) to Clovis and 117 mi (188 km) west to Alamogordo; US 285 leads north 192 mi (309 km) to Santa Fe and south 76 mi (122 km) to Carlsbad; and US 380 leads east 134 mi (216 km) to Brownfield, Texas, and west 164 mi (264 km) to Socorro.
According to the United States Census Bureau, Roswell has a total area of 29.9 square miles (77.5 km2), of which 29.8 square miles (77.3 km2) is land and 0.04 square miles (0.1 km2), or 0.19%, is covered by water.[4]
Climate[change | change source]
Roswell has a warm semi-arid climate with cool winters and very hot summers. In summer temperatures are expected to be 100 °F (38 °C) or above on average around 30 days per year. In winter daytime temperatures are often between 50 °F (10 °C) to 70 °F (21 °C) and nights can be below freezing due to the city's high altitude. In the summer Roswell and the rest of New Mexico is effected by the North American Monsoon which can bring heavy rainfall and flooding. The highest temperature recorded in Roswell was 114 °F (46 °C) on June 27, 1995 and the lowest temperature recorded was −24 °F (−31 °C) on January 11, 1962 and February 8, 1933. Temperatures at or above 110 °F (43 °C) occur one day per year, subzero temperatures are extremely rare with last one occurring on February 15, 2021. Average rainfall and snowfall is 11.6 inches (29 cm) and 9.6 inches (24 cm) respectively.
| Climate data for Roswell, New Mexico (Roswell Air Park), 1991–2020 normals,[a] extremes 1893–present | |||||||||||||
|---|---|---|---|---|---|---|---|---|---|---|---|---|---|
| Month | Jan | Feb | Mar | Apr | May | Jun | Jul | Aug | Sep | Oct | Nov | Dec | Year |
| Record high °F (°C) | 88 (31) |
91 (33) |
95 (35) |
102 (39) |
107 (42) |
114 (46) |
112 (44) |
111 (44) |
106 (41) |
99 (37) |
94 (34) |
84 (29) |
114 (46) |
| Mean maximum °F (°C) | 76.2 (24.6) |
80.4 (26.9) |
87.3 (30.7) |
93.1 (33.9) |
100.4 (38.0) |
106.3 (41.3) |
104.0 (40.0) |
102.5 (39.2) |
98.1 (36.7) |
93.0 (33.9) |
82.2 (27.9) |
75.3 (24.1) |
108.0 (42.2) |
| Average high °F (°C) | 57.3 (14.1) |
63.2 (17.3) |
71.0 (21.7) |
79.4 (26.3) |
87.8 (31.0) |
96.2 (35.7) |
96.5 (35.8) |
94.6 (34.8) |
87.6 (30.9) |
77.7 (25.4) |
65.7 (18.7) |
56.5 (13.6) |
77.8 (25.4) |
| Average low °F (°C) | 28.1 (−2.2) |
32.5 (0.3) |
39.4 (4.1) |
47.0 (8.3) |
56.7 (13.7) |
65.7 (18.7) |
69.9 (21.1) |
68.6 (20.3) |
61.2 (16.2) |
48.8 (9.3) |
36.3 (2.4) |
28.1 (−2.2) |
48.5 (9.2) |
| Mean minimum °F (°C) | 14.4 (−9.8) |
17.3 (−8.2) |
23.0 (−5.0) |
31.4 (−0.3) |
44.0 (6.7) |
55.9 (13.3) |
63.2 (17.3) |
61.3 (16.3) |
48.8 (9.3) |
32.4 (0.2) |
20.0 (−6.7) |
12.0 (−11.1) |
9.3 (−12.6) |
| Record low °F (°C) | −24 (−31) |
−24 (−31) |
−5 (−21) |
17 (−8) |
27 (−3) |
40 (4) |
52 (11) |
48 (9) |
30 (−1) |
14 (−10) |
−6 (−21) |
−10 (−23) |
−24 (−31) |
| Average precipitation inches (mm) | 0.36 (9.1) |
0.35 (8.9) |
0.54 (14) |
0.57 (14) |
1.14 (29) |
1.28 (33) |
1.82 (46) |
1.68 (43) |
1.55 (39) |
1.33 (34) |
0.45 (11) |
0.56 (14) |
11.63 (295) |
| Average snowfall inches (cm) | 2.4 (6.1) |
1.1 (2.8) |
0.7 (1.8) |
0 (0) |
0 (0) |
0 (0) |
0 (0) |
0 (0) |
0 (0) |
0.4 (1.0) |
1.2 (3.0) |
3.8 (9.7) |
9.6 (24) |
| Average precipitation days (≥ 0.01 in) | 3.4 | 3.1 | 3.3 | 2.9 | 4.4 | 5.3 | 6.9 | 8.1 | 6.0 | 5.0 | 2.8 | 3.9 | 55.1 |
| Average snowy days (≥ 0.1 in) | 2.0 | 1.0 | 0.7 | 0.3 | 0 | 0 | 0 | 0 | 0 | 0.2 | 0.6 | 1.8 | 6.6 |
| Average relative humidity (%) | 56.8 | 51.1 | 39.7 | 36.5 | 39.6 | 43.2 | 49.1 | 54.1 | 57.6 | 54.0 | 52.7 | 54.5 | 49.1 |
| Average dew point °F (°C) | 21.9 (−5.6) |
23.9 (−4.5) |
25.0 (−3.9) |
29.8 (−1.2) |
39.0 (3.9) |
49.6 (9.8) |
56.8 (13.8) |
57.7 (14.3) |
52.5 (11.4) |
40.8 (4.9) |
28.6 (−1.9) |
21.6 (−5.8) |
37.3 (2.9) |
| Mean monthly sunshine hours | 217.1 | 223.0 | 280.8 | 307.6 | 342.9 | 344.7 | 327.9 | 300.9 | 262.7 | 269.6 | 214.5 | 210.3 | 3,302 |
| Percent possible sunshine | 68 | 72 | 76 | 79 | 80 | 80 | 75 | 73 | 71 | 77 | 68 | 68 | 74 |
| Source 1: NOAA (relative humidity and dew point 1973–1990, sun 1962–1982)[5][6][7] | |||||||||||||
| Source 2: https://www.ncei.noaa.gov/access/us-climate-normals/ | |||||||||||||
References[change | change source]
- ↑ "ArcGIS REST Services Directory". United States Census Bureau. Retrieved October 12, 2022.
- ↑ "QuickFacts: Roswell city, New Mexico". United States Census Bureau. Retrieved March 14, 2024.
- ↑ "Encyclopedia of the Great Plains | ROSWELL, NEW MEXICO".
- ↑ "Geographic Identifiers: 2010 Demographic Profile Data (G001): Roswell city, New Mexico (revision of 01-02-2013)". U.S. Census Bureau, American Factfinder. Archived from the original on February 12, 2020. Retrieved October 16, 2014.
- ↑ "NowData – NOAA Online Weather Data". National Oceanic and Atmospheric Administration. Retrieved 2020-08-29.
- ↑ "Station Name: NM ROSWELL IND AIR PK". National Oceanic and Atmospheric Administration. Retrieved June 6, 2015.[permanent dead link]
- ↑ "WMO Climate Normals for Roswell/Industrial Air Park, NM 1961–1990". National Oceanic and Atmospheric Administration. Retrieved 2020-08-29.
- Notes
- ↑ Mean monthly maxima and minima (i.e. the expected highest and lowest temperature readings at any point during the year or given month) calculated based on data at said location from 1991 to 2020.


